Quantcast

Prairie State Wire

Thursday, May 2, 2024

Big red states gain, big blue states drain when it comes to 2023 population growth – A Wirepoints 50-state survey

Webp tdorante10

More people have been moving to red states from blue states. | Wikimedia Commons / Tdorante10

More people have been moving to red states from blue states. | Wikimedia Commons / Tdorante10

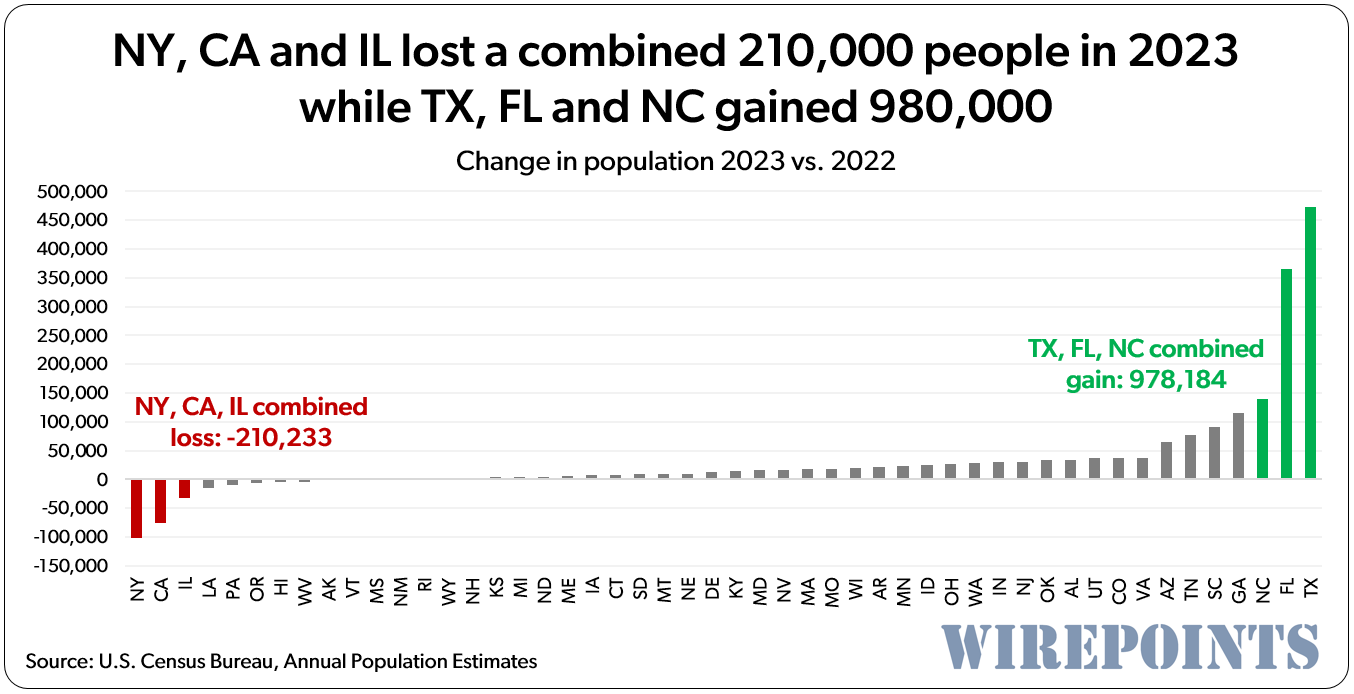
The multi-year pattern of population growth among the nation’s big red states – and shrinkage among the big blue – continued in 2023.

The deep-red states of Texas and Florida grew their populations by more than 470,000 and 365,000 respectively while red North Carolina grew by nearly 140,000. In all, the three grew by nearly 1 million people. These states remain a magnet for both Americans and foreigners alike. 

Meanwhile, deep-blue New York, California and Illinois, are only driving more Americans away. New York and California, lost 102,000 and 75,000 people respectively while Illinois lost another 32,000. The combined loss totaled more than 210,000.

These findings are based on a Wirepoints’ analysis of the latest 2023 population estimates provided by the U.S. Census Bureau on December 22. The bureau performs a population estimate each year in addition to its full decennial census count at the end of each decade.

A look at percentage growth/decline

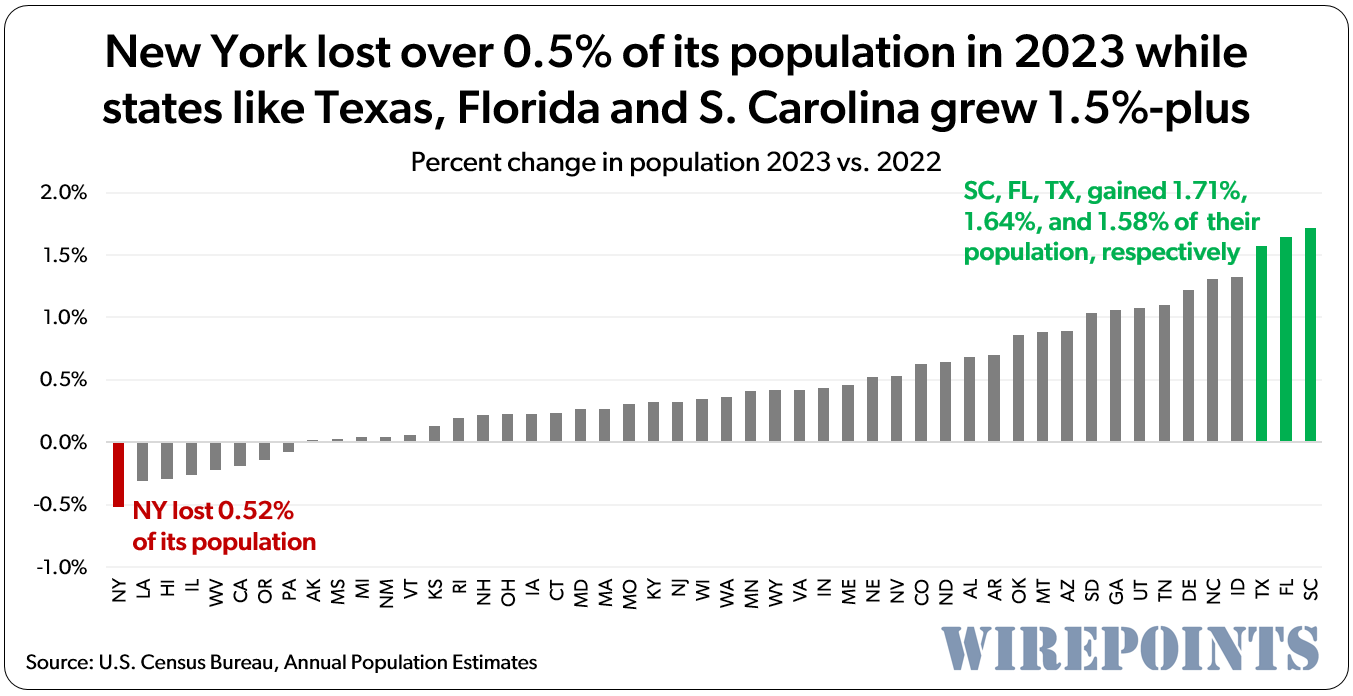
The nation’s winners and losers on a percentage basis are similar to those listed above. New York was the biggest loser, with more than 0.5 percent of its population disappearing between 2022 and 2023. Louisiana and Hawaii were next with declines of about 0.3 percent. Illinois, West Virginia, and California followed.

On the flip side, South Carolina, Florida and Texas all experienced population gains above 1.5 percent, with South Carolina’s 1.71 percent increase being the nation’s big winner.

The three-year trend

The divide between the nation’s winners and losers is even more pronounced when adding up changes over the post-decennial 2020-2023 period.

Both Texas and Florida have added more than one million in population – no other states come close. They’re near the top on a percentage basis too. Idaho’s population has grown 6.2 percent since 2020, followed by Florida and South Carolina up 4.7 percent and Texas at 4.3 percent.

In contrast, both California and New York have each seen their populations shrink by over 500,000 and Illinois has lost nearly a quarter-million people – the nation’s third-worst decline.

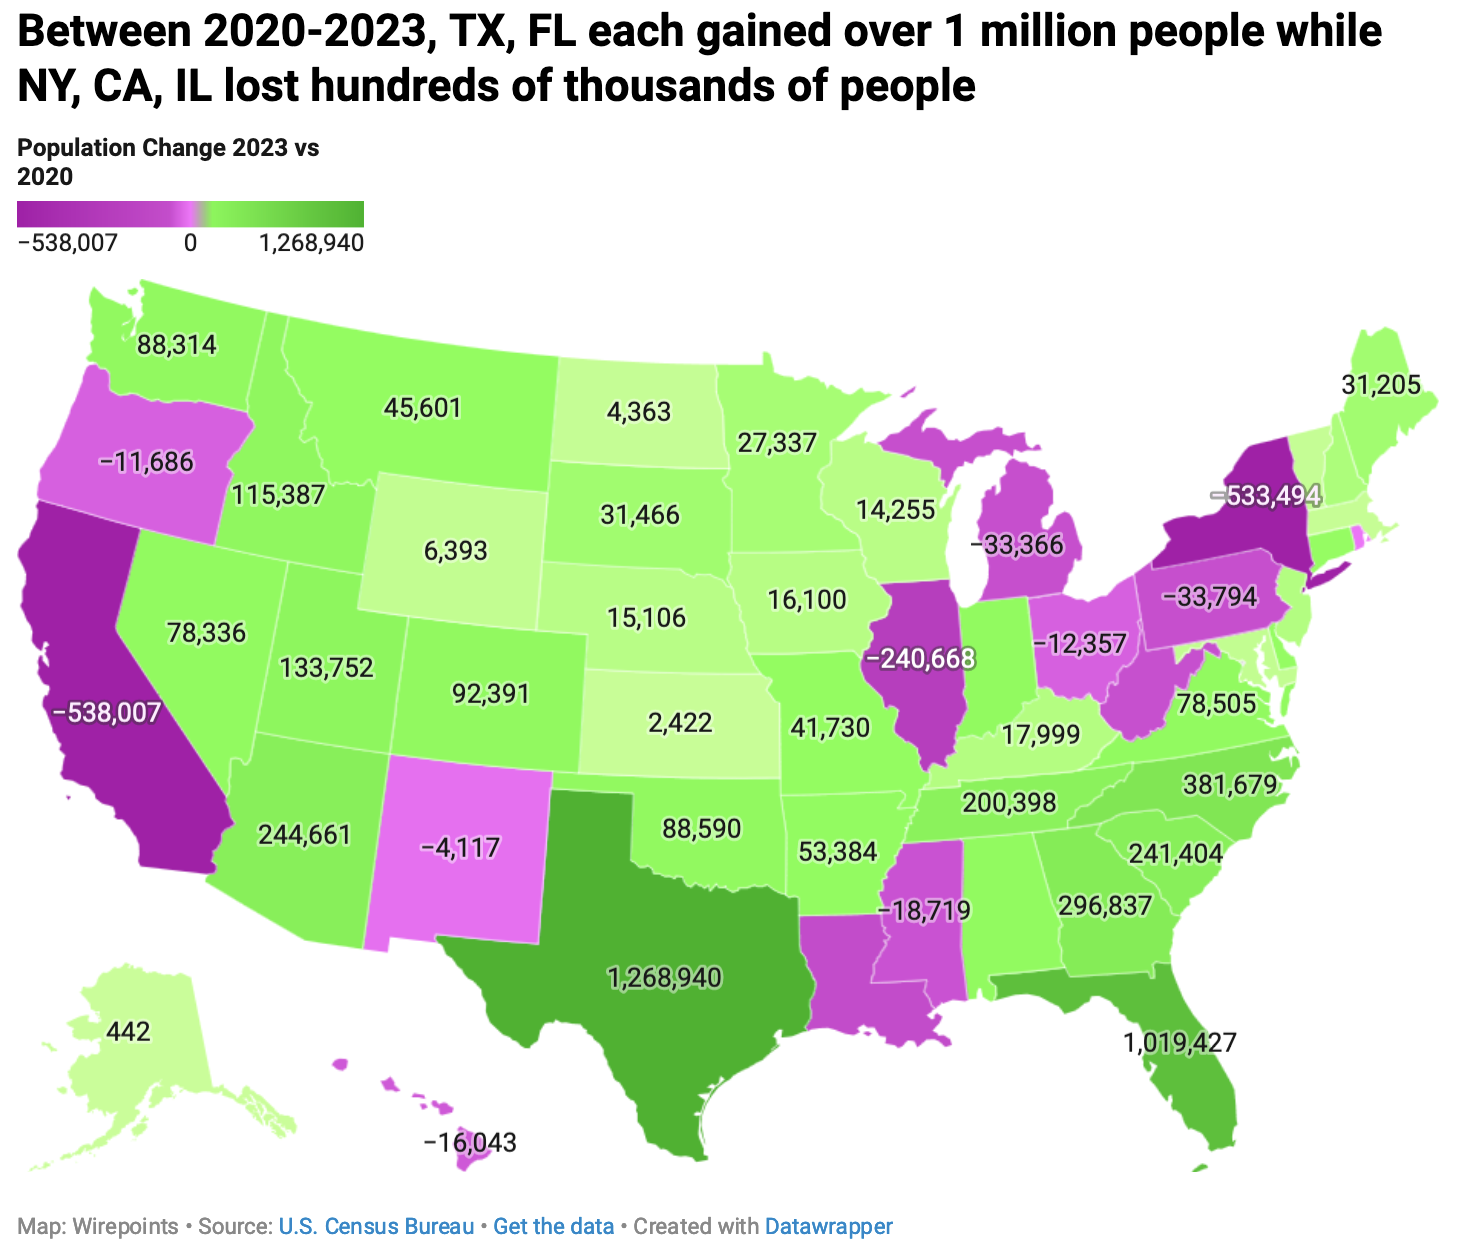
On a percentage basis, Illinois’ 1.9 percent loss comes only 2nd behind New York, which has lost 2.7 percent of its population since 2000.

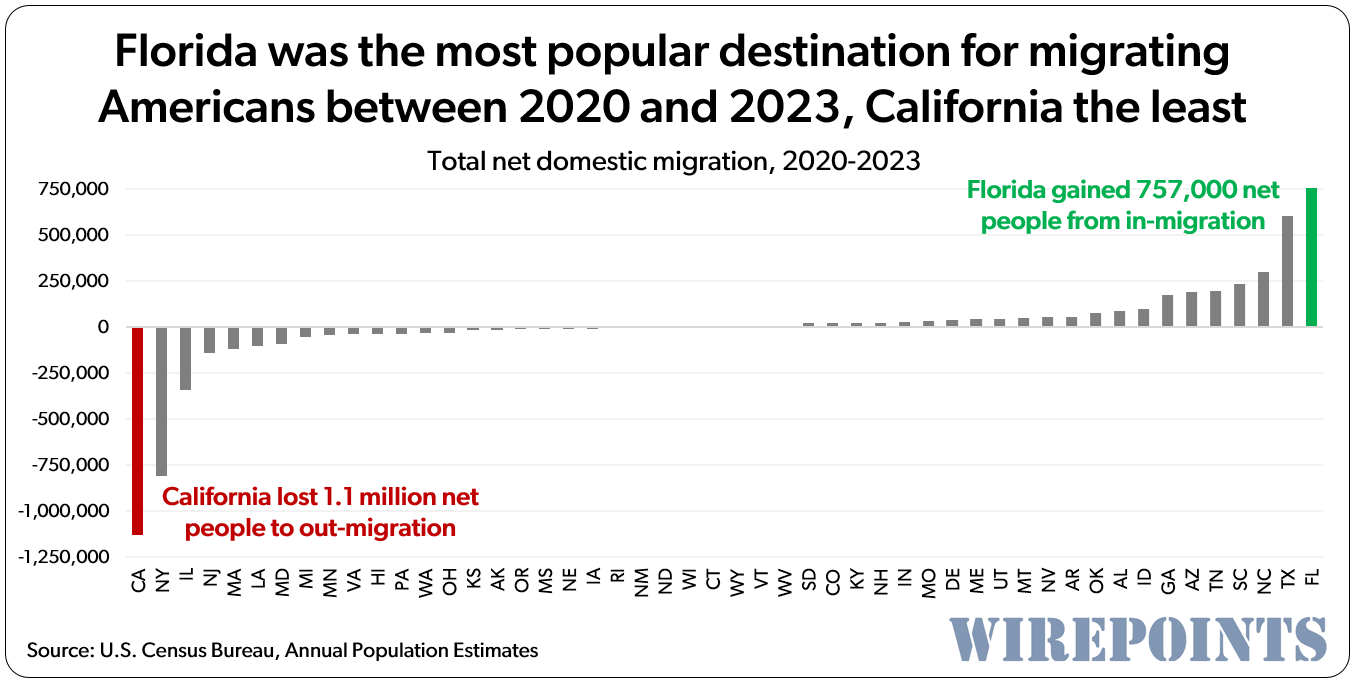
The single biggest driver of population changes among the 50 states continues to be domestic migration – the movement of Americans from one state to another.

Florida was the nation’s top destination state between 2020 and 2023, with a net 757,000 people deciding to make the Sunshine State their home. Texas was next, with a net migration of nearly 603,000 Americans.

California suffered the most in the country with more than 1.1 million net people deciding to leave. New York and Illinois were the runners-up, with losses of nearly 810,000 and 342,000 people, respectively.

Another round of winners and losers

2023 was a year of “returning to norms” after years of pandemic chaos, according to the Census Bureau. 

Those norms are clear: Deep-red Texas and Florida, along with states like the Carolinas, are winning the competition for people and their wealth. And they have been for more than a decade.

In contrast, blue states like New York, California and Illinois are structural losers – bleeding domestic migrants and seeing their populations shrink.

One set of states is rapidly garnering increased advantages in both economic investment and political influence. The other set is losing, badly.

Appendix.

U.S. Census Population Data 2020-2023 

State2020

Population

2021

Population

2022

Population

2023

Population

Population Change               2022 to 2023Percent

Change               2022 vs 2023

Population

Change             2023 vs 2020

Percent

Change.            2023 vs 2020

Texas29,234,36129,561,28630,029,84830,503,301473,453.001.60%1,268,9404.30%
Florida21,591,29921,830,70822,245,52122,610,726365,205.001.60%1,019,4274.70%
North Carolina10,453,81210,567,10010,695,96510,835,491139,526.001.30%381,6793.70%
Georgia10,732,39010,790,38510,913,15011,029,227116,077.001.10%296,8372.80%
Arizona7,186,6837,272,4877,365,6847,431,34465,660.000.90%244,6613.40%
South Carolina5,132,1515,193,8485,282,9555,373,55590,600.001.70%241,4044.70%
Tennessee6,926,0916,963,7097,048,9767,126,48977,513.001.10%200,3982.90%
Utah3,283,9823,339,2843,381,2363,417,73436,498.001.10%133,7524.10%
Idaho1,849,3391,904,5371,938,9961,964,72625,730.001.30%115,3876.20%
Colorado5,785,2195,811,5965,841,0395,877,61036,571.000.60%92,3911.60%
Oklahoma3,965,2343,991,6344,019,2714,053,82434,553.000.90%88,5902.20%
Washington7,724,5667,741,4337,784,4777,812,88028,403.000.40%88,3141.10%
Virginia8,637,1938,657,3488,679,0998,715,69836,599.000.40%78,5050.90%
Nevada3,115,8403,146,6323,177,4213,194,17616,755.000.50%78,3362.50%
Alabama5,031,8645,050,3805,073,9035,108,46834,565.000.70%76,6041.50%
Indiana6,789,0986,813,7986,832,2746,862,19929,925.000.40%73,1011.10%
Arkansas3,014,3483,028,4433,046,4043,067,73221,328.000.70%53,3841.80%
Montana1,087,2111,106,3661,122,8781,132,8129,934.000.90%45,6014.20%
Missouri6,154,4266,170,3936,177,1686,196,15618,988.000.30%41,7300.70%
Delaware991,8621,004,8811,019,4591,031,89012,431.001.20%40,0284.00%
Connecticut3,577,5863,603,6913,608,7063,617,1768,470.000.20%39,5901.10%
South Dakota887,852896,299909,869919,3189,449.001.00%31,4663.50%
Maine1,364,5171,378,7871,389,3381,395,7226,384.000.50%31,2052.30%
Minnesota5,710,5785,717,9685,714,3005,737,91523,615.000.40%27,3370.50%
New Hampshire1,378,7021,387,4941,399,0031,402,0543,051.000.20%23,3521.70%
New Jersey9,272,3929,269,1759,260,8179,290,84130,024.000.30%18,4490.20%
Kentucky4,508,1554,507,6004,511,5634,526,15414,591.000.30%17,9990.40%
Iowa3,190,9043,197,9443,199,6933,207,0047,311.000.20%16,1000.50%
Nebraska1,963,2731,964,2531,968,0601,978,37910,319.000.50%15,1060.80%
Wisconsin5,896,7005,879,9785,890,5435,910,95520,412.000.30%14,2550.20%
Maryland6,173,6896,175,0456,163,9816,180,25316,272.000.30%6,5640.10%
Wyoming577,664579,548581,629584,0572,428.000.40%6,3931.10%
Vermont642,936647,093647,110647,4643540.10%4,5280.70%
North Dakota779,563777,982778,912783,9265,014.000.60%4,3630.60%
Massachusetts6,997,7136,991,9516,982,7407,001,39918,659.000.30%3,6860.10%
Kansas2,938,1242,937,9462,936,7162,940,5463,830.000.10%2,4220.10%
Alaska732,964734,923733,276733,4061300.00%4420.10%
Rhode Island1,096,4441,097,0921,093,8421,095,9622,120.000.20%−4820.00%
New Mexico2,118,4882,116,9502,113,4762,114,3718950.00%−4,117−0.2%
Oregon4,245,0444,256,4654,239,3794,233,358−6,021.00−0.1%−11,686−0.3%
Ohio11,798,29211,765,22711,759,69711,785,93526,238.000.20%−12,357−0.1%
Hawaii1,451,1811,446,7451,439,3991,435,138−4,261.00−0.3%−16,043−1.1%
Mississippi2,958,4092,949,5822,938,9282,939,6907620.00%−18,719−0.6%
West Virginia1,791,5621,785,2491,774,0351,770,071−3,964.00−0.2%−21,491−1.2%
Michigan10,070,62710,038,11710,033,28110,037,2613,980.000.00%−33,366−0.3%
Pennsylvania12,995,47713,013,61412,972,09112,961,683−10,408.00−0.1%−33,794−0.3%
Louisiana4,652,0224,627,0474,588,0234,573,749−14,274.00−0.3%−78,273−1.7%
Illinois12,790,35712,690,34112,582,51512,549,689−32,826.00−0.3%−240,668−1.9%
New York20,104,71019,854,52619,673,20019,571,216−101,984.00−0.5%−533,494−2.7%
California39,503,20039,145,06039,040,61638,965,193−75,423.00−0.2%−538,007−1.4%

ORGANIZATIONS IN THIS STORY

!RECEIVE ALERTS

The next time we write about any of these orgs, we’ll email you a link to the story. You may edit your settings or unsubscribe at any time.
Sign-up

DONATE

Help support the Metric Media Foundation's mission to restore community based news.
Donate

MORE NEWS